How do I add a 2D Plot along with a surface or mesh plot in MATLAB?
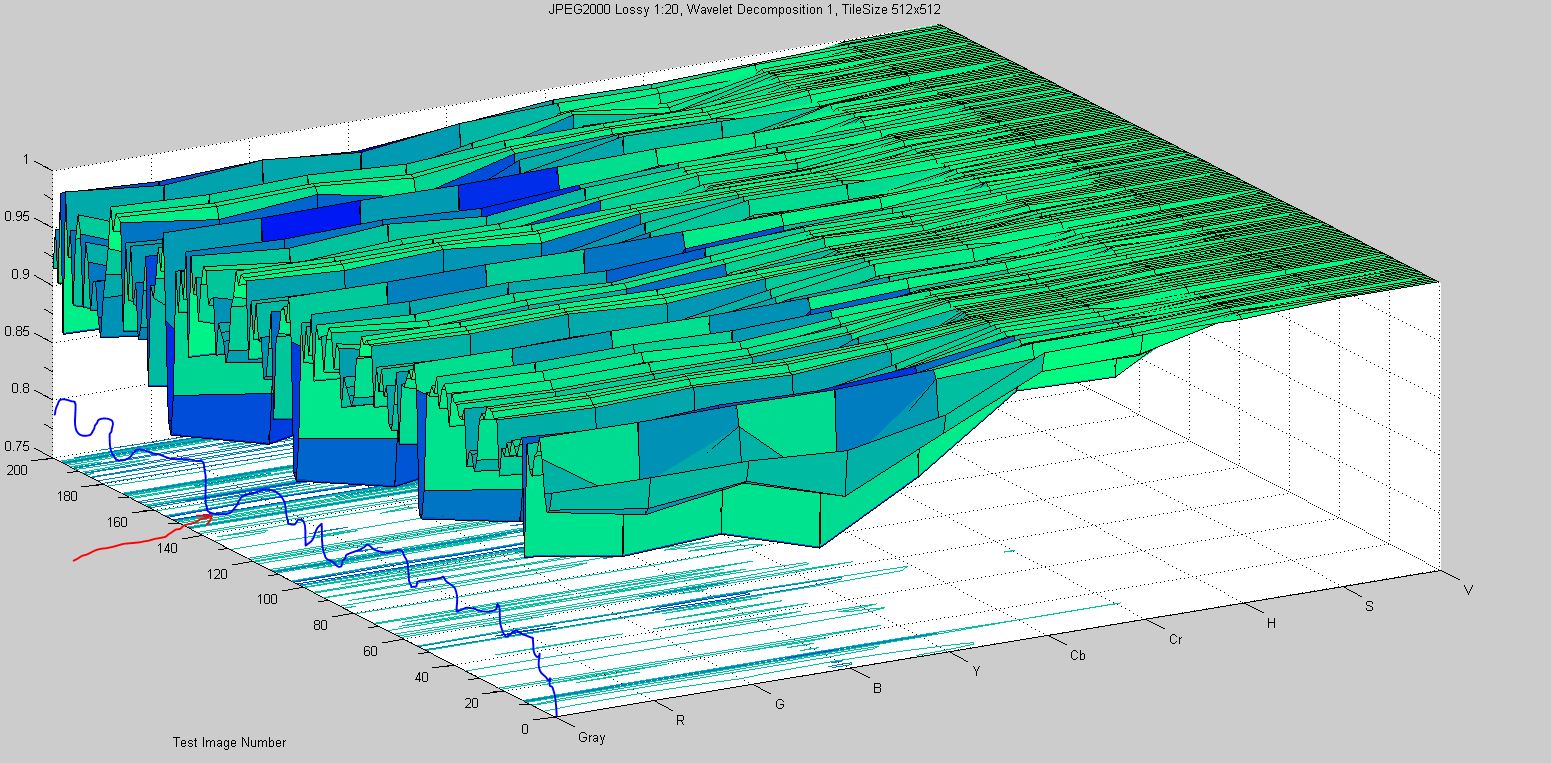
I would like to have a 2D plot along with a 3D surface or mesh plot - shown by the blue line I drew on the surface plot below. How do I get it?

UPDATE: Natan's Solution worked :-) But I now have a new Problem - How do I add 2 Y axis to my MATLAB Plot?
Solution
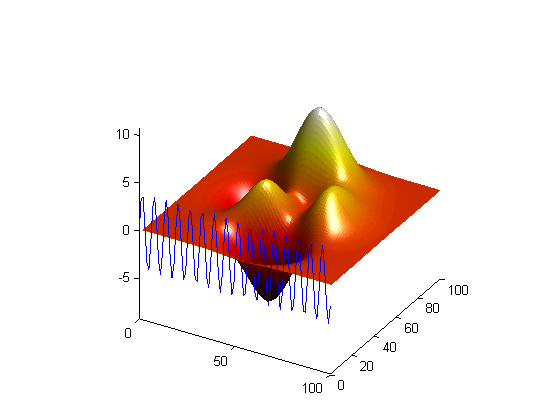
Just add to the surf plot another plot using plot3 where the relevant axis has the limits of the surf plot.
For example:
z=peaks(100);
surface(z, 'EdgeColor', 'none');
colormap(hot)
view(30,30); camlight; axis vis3d

x1=linspace(0,100);
hold on
plot3(x1,0*ones(1,numel(x1)),4*sin(x1))

- Why is im2col more efficient than naive 2d convolution?
- Concatenating empty array in Numpy
- Why doesn't Matlabs Isosurface work here?
- Save exact image output from imagesc in matlab
- How to change the order of lines in a Matlab figure?
- What is the difference between .m and .mat files in MATLAB
- How to add a legend without plot rescaling?
- Is there a more elegant way to write sum in MATLAB code
- Plotting arrays using a grouped horizontal bar graph
- Coloring Triangulation from Set of Points
- Matlab image features extraction error (ifcb-analysis)
- How to zoom in/out in Matlab editor?
- 1D Poisson equation in MATLAB
- How to implement delta E color difference method of an image in matlab?
- Plotting a function inside a polygon in MATLAB
- Is there a way to make an anonymous function without output?
- Matlab function for lorentzian fit with global variables
- Error forming mini-batch for network input
- Constraining parameters using mldivide
- Pyramidal Histogram Of Oriented Gradients - Trilinear interpolation
- How to know the size of a variable in MATLAB
- How to get the next higher power of 2?
- Unable to understand product of Sinusoid signal with Hann window function in MATLAB R2024b
- List of all built-in symbols in Matlab/Octave
- Handling large number of name/value parameters in MATLAB
- Infusion-pump Model- PID-controller- running very slow
- What is contained in the "function workspace" field in .mat file?
- `numpy.testing.assert_array_equal` fails when comparing structured numpy arrays with array fields
- MATLAB reports "Exception in thread "AWT-EventQueue-0" java.lang.NullPointerException"
- Proper way to add noise to signal