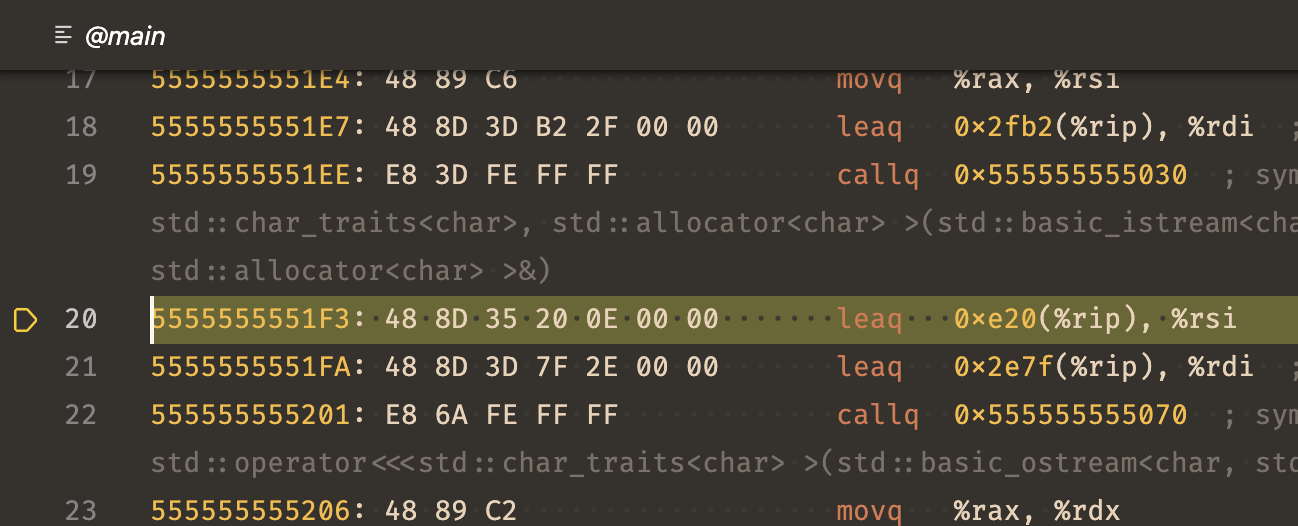
Does VS Code have a memory viewer and/or a disassembler for C++ extension?
I am using Visual Studio Code (VS Code) for debugging my C++ program. I'd like to view the memory at a variable's address and also be able to view the assembly code of my program. I am looking around on VS Code and I am not seeing an option for such views. I checked around on the marketplace and I don't anything out there.
Not sure if I am not looking in the right place, but do these features exist for VS Code?
When this question was first asked, neither the disassembly view nor the memory viewer were available.
In July of 2021, the disassembly view was released, which can be opened by clicking "Open Disassembly View" in the context menu of an editor. This is supported both by the generic C++ debugger debugger, and LLDB debugger has a "Toggle Disassembly" command which works quite well.
In February of 2022, the memory view was released in VS Code, which can be accessed by hovering on a variable in the "Variables" view.
- How to print the data of a C structure in Windbg
- How does this code find duplicate characters in a string?
- Does there exist a reversed comma operator in C?
- C struct assignment by unnamed struct initialized by member-wise list, syntax candy or unintentional memory overhead?
- How do I assert that two pointers are equal with GLib's testing framework?
- Random password generator + algorithm
- C: printf a float value
- Weird behaviour of Java FFM on Windows platform when creating upcalls accepting both structure and pointer parameters
- How does C know that you're out of bounds in a multi dimensional array?
- Stack vs. heap pointers in C
- Writing a Von Neumann Ordinal generator in C : Problem with malloc
- multiple definition of main first defined here
- Justification of storing metadata in 2 least significant bits of address
- MIN and MAX in C
- Comma in C/C++ macro
- How can I pass several arguments through a single void pointer argument?
- C - determine if a number is prime
- Implementation of __builtin_clz
- Modern Delphi to C strings for passing to C DLLs
- How to compile and run C files from within Notepad++ using NppExec plugin?
- Is it safe to close a duplicated token handle during impersonating with ImpersonateLoggedOnUser?
- C - Error is "free(): invalid next size (normal) "
- GtkTreeStore Subclass, Error When Reloading Plugin
- Elegant way to define an automatic variable with specific alignment
- error LNK2005: xxx already defined in MSVCRT.lib(MSVCR100.dll) C:\something\LIBCMT.lib(setlocal.obj)
- Is the C programming language object-oriented?
- Standard alternative to GCC's ##__VA_ARGS__ trick?
- Why is malloc returning NULL here?
- What does "for (;;)" (for keyword followed by a pair of semicolons in parentheses) mean?
- Can I programming OpenGL4+ in a card that support 2.1 only?

