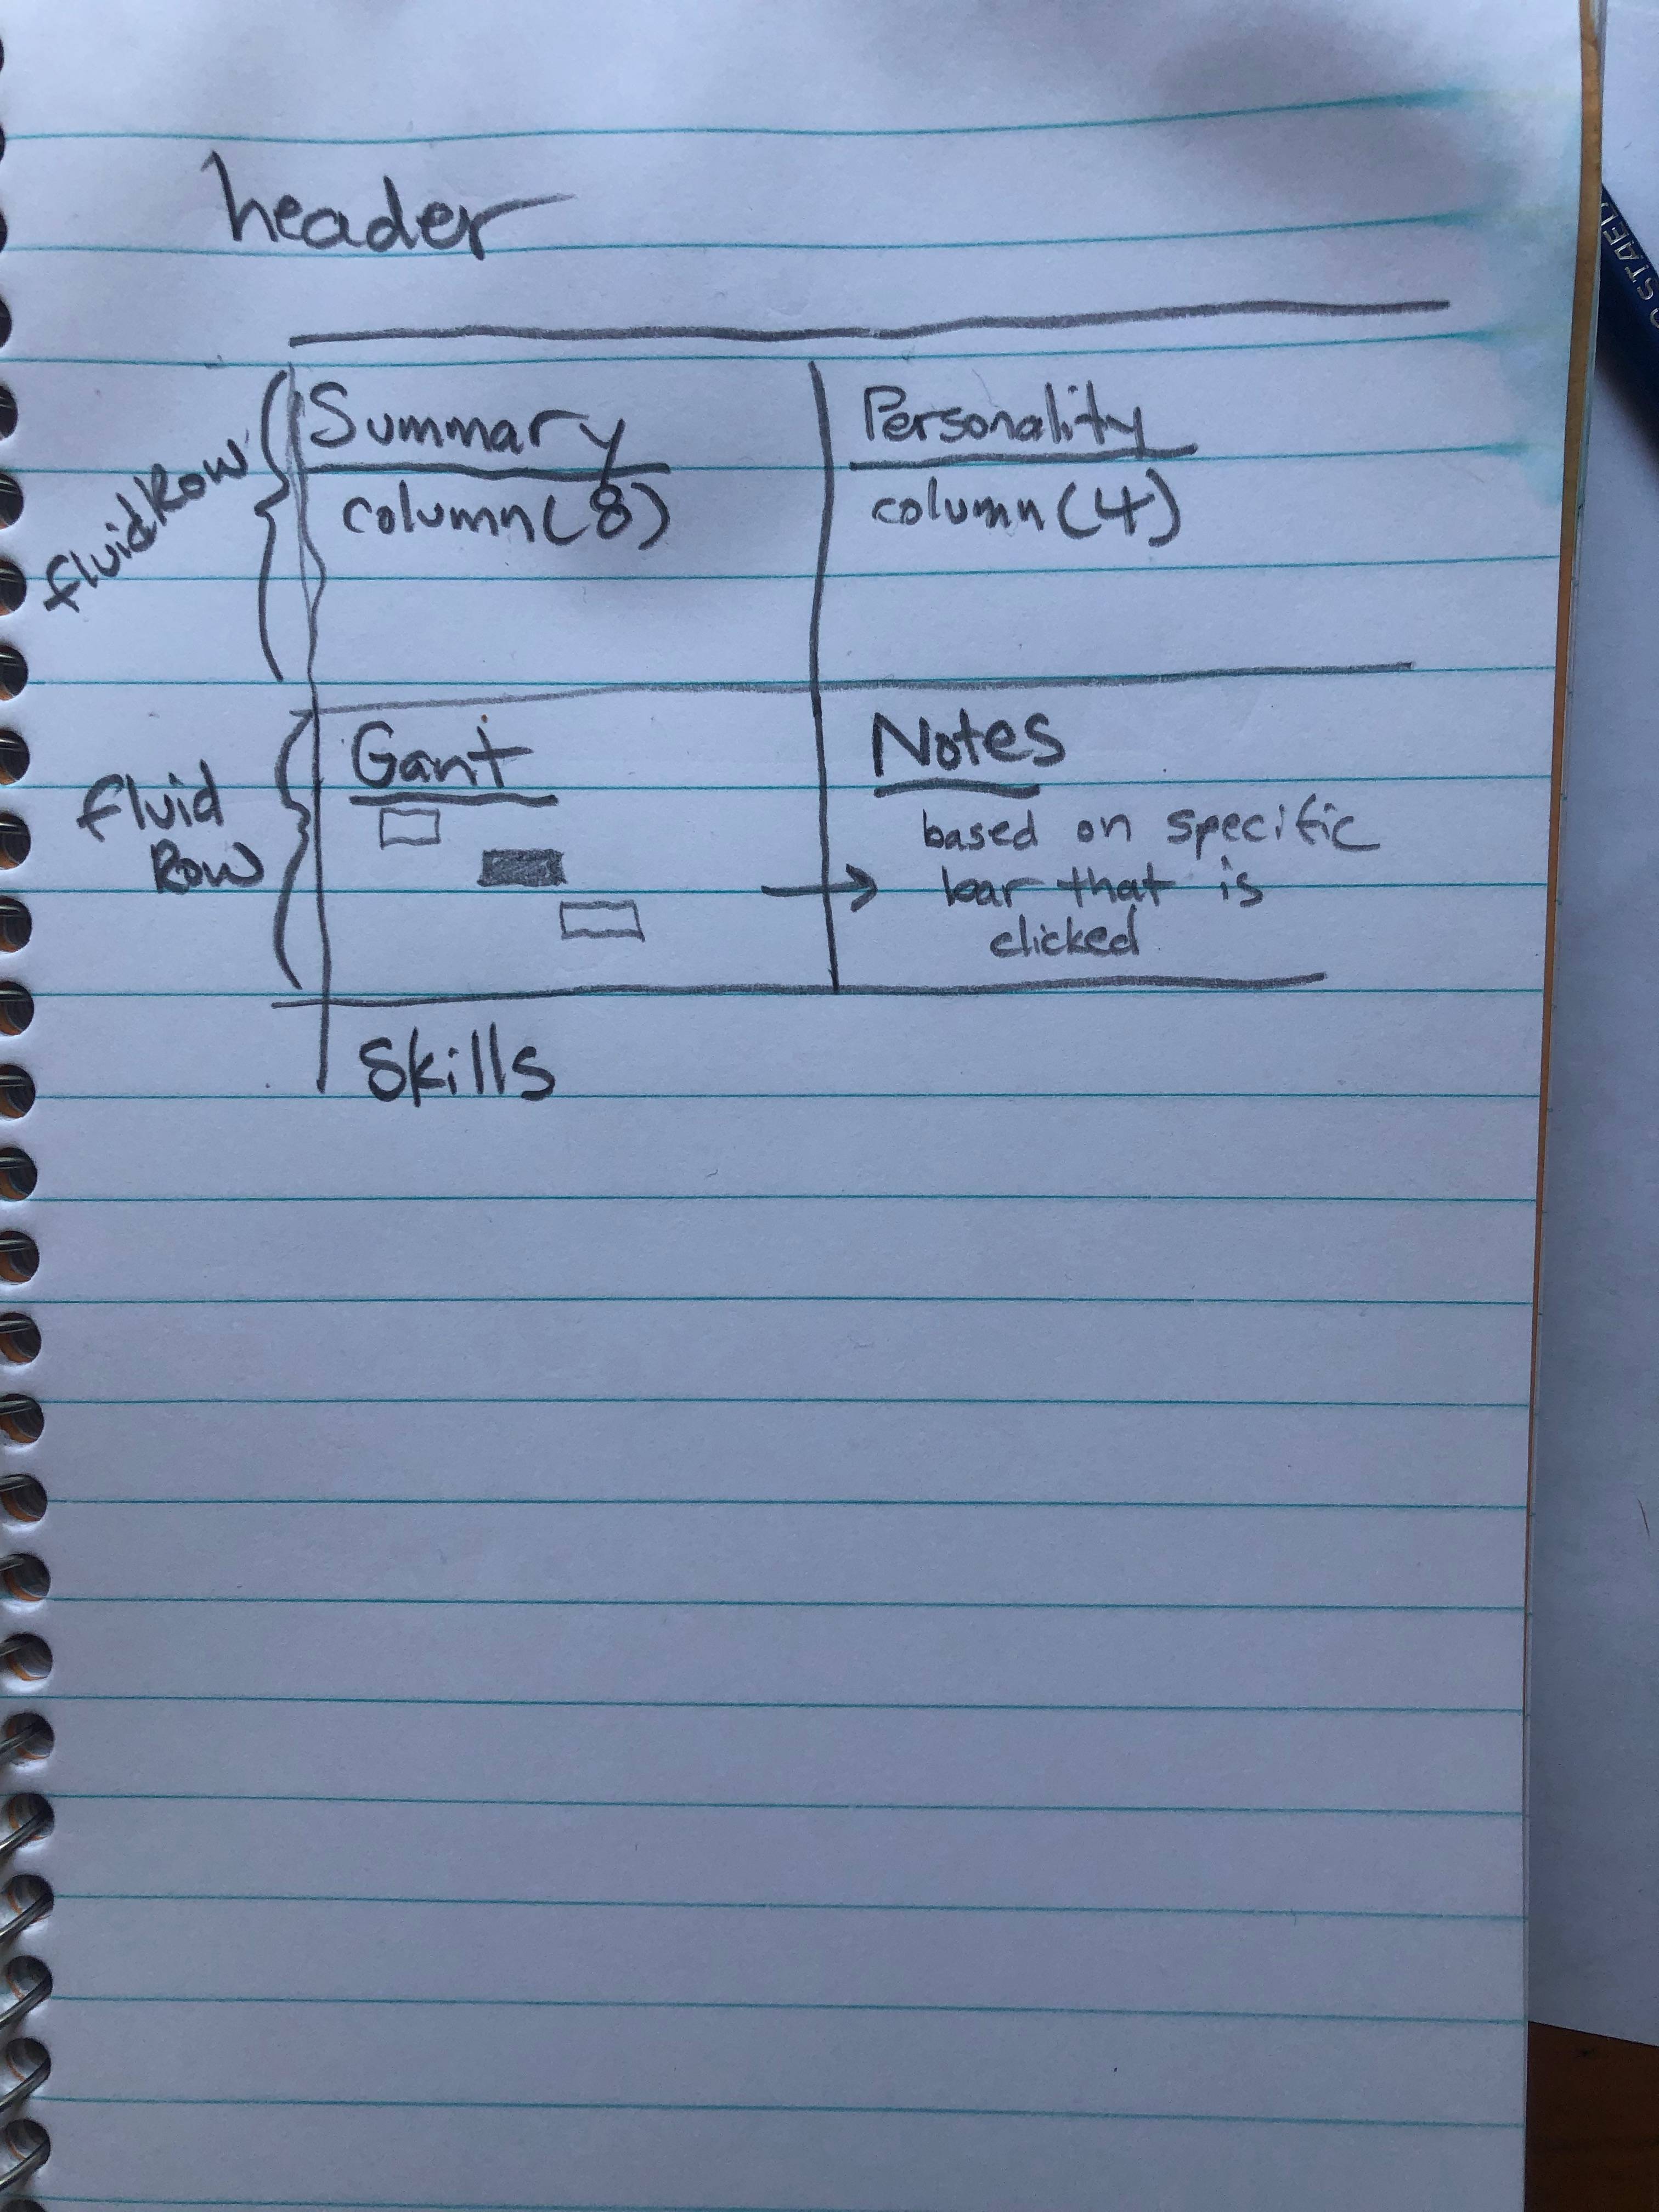
R Shiny output based on clicking on interactive plot
I am trying to make an Shiny app. In one row I have two columns, in the first column is a gant chart. I want to make it so that when you click on one of the bars, it shows text associated with that experience in the other column.
Here is an example of the data for my gant chart.
    > experiences_head
       Type           Institution           Degree                Major start finish                                                 name
1 Education     McGill University           B. Eng    Civil Engineering  1995   1999       McGill University - B. Eng - Civil Engineering
2 Education University of Toronto            M.Eng Chemical Engineering  2000   2002 University of Toronto - M.Eng - Chemical Engineering
3 Education University of Toronto             Ph.D Chemical Engineering  2002   2008  University of Toronto - Ph.D - Chemical Engineering
4      Work Geosyntec Consultants       Consultant                       2008   2009                   Geosyntec Consultants - Consultant
5      Work                  EMBL Bioinformatician                       2009   2013                              EMBL - Bioinformatician
6      Work                  EMBL   Data Scientist                       2013   2016                                EMBL - Data Scientist
                                notes
1                   Wastwater project
2                Treatability Studies
3 Optimizing Cuture growth conditions
4                 Biomarker protocols
I have read the 'similar' posts that come up on this, but am a bit lost. Im a bit stuck, am thinking that I need to use click in the plotoutput and observeEvents somewhere.
     source("resume_functions.R")
    ui<-
          fluidRow(
            id = "title_bar",
            titlePanel(title = "Shiny Resume")
          ),
          fluidRow(
            # Text Section ----
            column(
              width = 8,

              # Description ----
              h3("Personal Summary"),
              p(Personal_summary)
            ),
          column(
            width=4,
            h3("Personality"),
            plotOutput('radar')
          )
          ),
          fluidRow(
            column(
              width=8,
              h3("Experience"),
                plotOutput("gant",click="gant_bar")
            ),
            column(
              width=4,
              h3("Competencies"),
              textOutput("exp_notes")
            )
          ),
          fluidRow(id="Skills",
                   h3("Skills"),
                   plotOutput("skills")
                   )

        ) # end ui

        server <- function(input, output) {

          # radar personality plo
          output$radar <- renderPlot({
            radar_plot(personality_data_w)
          })

          # Gant Plot ----
          output$gant <- renderPlot({
            plot_gant(experiences)
          })
          ## plot Notes based on which bar is clicked on gant
  ##
  output$exp_notes <- renderText({
    req(input$plot_click)
    browser() #interactive debugger
    near_points(experiences,input$plot_click)  # ? don't know how to specify that I want text from a specific column
  })
          # skills Plot ----
          output$skills <- renderPlot({
            skills_lolli_plot(datAnal_skills)
          })
        }
Solution
Since you have not provided the function plot_gant, I created my own version of a Gantt chart to demonstrate how to display the notes:
library(tidyverse)
library(shiny)

experiences <- tribble(
  ~name, ~start, ~finish, ~notes,
  "Civil Engineering", 1995, 1999, "Wastwater project",
  "M.Eng Chemical Engineering", 2000, 2002, "Treatability Studies",
  "Ph.D - Chemical Engineering", 2002, 2008, "Optimizing growth conditions"
)

ui <- fluidPage(
  plotOutput("gant", click = "gant_click"),
  textOutput("notes")
)

server <- function(input, output, session) {
  output$notes <- renderText({
    req(input$gant_click)

    # input is continiously scaled.
    # round to get next row id
    # y if coord_flip(), x otherwise
    row_id <- round(input$gant_click$y)

    str_glue(
      "clicked:", experiences[[row_id, "name"]],
      "notes:", experiences[[row_id, "notes"]],
      .sep = "\n"
    )
  })

  output$gant <- renderPlot({
    experiences %>%
      ggplot(aes(x = name)) +
      geom_linerange(aes(ymin = start, ymax = finish), size = 10) +
      coord_flip()
  })
}

shinyApp(ui, server)
- Simple question: how to add text to r chunk in rmd format?
- Issue with Label Behaviour in gganimate
- Combine census tracts with neighbor to reach a population threshold in R
- Creating a single map composed of three separate shapefiles
- Implementation of Cobb-Douglas Utility Function to calculate Receiver Operator Curve & AUC
- Overall percentages based on total count
- Pairwise dissimilarities nesting a time-series loop inside a site loop - multiple times
- Long/Lat points keep ending up in Kansas
- How to sum a column dependent on a value in another column
- Customize label for an Interaction Plot
- How to obtain RMSE out of lm result?
- Faceted mosaic plots with the same area scaling
- Unite columns with unique values
- How to print the current map while preserving data points
- How to solve error: mismatched lengths of ids and values when data has missing values in geom_line_interactive()?
- How do I transfer NAs from one dataframe to same position in a second dataframe
- Creating bar plots using ggplot, running into issues with data format
- Force initial zoom to truncate portion of the data
- R - select only factor columns of dataframe
- How to scale the units of the data & trend components of an autoplot of a multiplicative decomposition of a time series?
- Respect ratio when using ggarrange() and geom_sf()
- Changing size / aspect ratio of leaflet
- How do I use the lubridate package to calculate the number of months between two date vectors where one of the vectors has NA values?
- Adding to logos to flexdashboard
- R replace values of a column based on exact match of another data frame
- Error in grepl(pattern, df): invalid regular expression
- regular expression in R, reuse matched string in replacement
- Substract minimum value of row from each element of row in dataframe,
- R Reticulate does work with for loop but not purrr::map2
- Count all values in a correlation matrix that are above 0.8 and below -0.8
