Linking filters in R Shiny
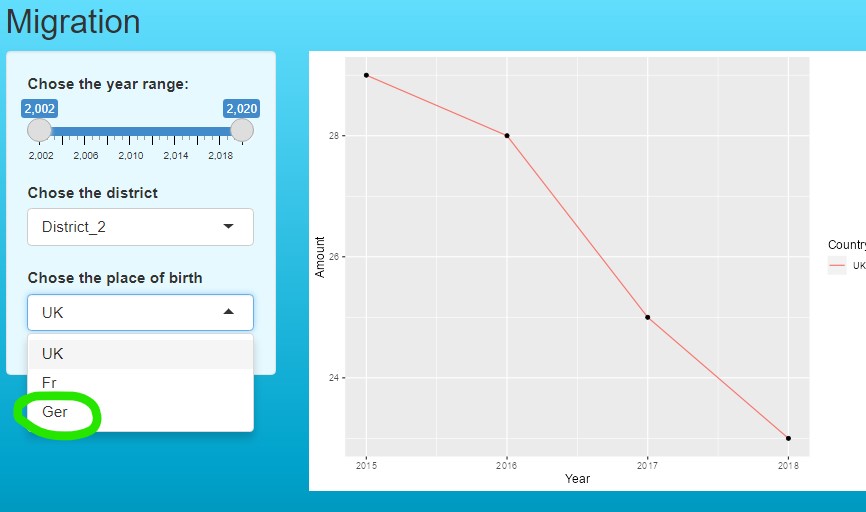
I have a problem creating a simple application in R Shiny. I have several filters and I need the options in the filters to change depending on the selected values at others filters. I borrowed this example (https://stackoverflow.com/a/56206037) and modified it slightly. In the input dataframe I have 2 Districts and 3 Countries. Only Germany has only District 1. So if I choose District 2 in the filter, then in the second filter I need only countries that have District 2 to be displayed.
library(shiny)
library(shinyWidgets)
library(ggplot2)
library(dplyr)


Eu1 <- data.frame(stringsAsFactors=FALSE,
                  Year = c(2018, 2017, 2016, 2015, 2018, 2017, 2016, 2015, 2018, 2017,
                           2016, 2015, 2018, 2017, 2016, 2015, 2018, 2017, 2016, 2015),
                  Districts = c("District_1", "District_1", "District_1", "District_1",
                                "District_1", "District_1", "District_1", "District_1",
                                "District_1", "District_1", "District_1", "District_1", "District_2",
                                "District_2", "District_2", "District_2", "District_2",
                                "District_2", "District_2", "District_2"),
                  Country = c("UK", "UK", "UK", "UK", "Fr", "Fr", "Fr", "Fr", "Ger", "Ger",
                              "Ger", "Ger", "Fr", "Fr", "Fr", "Fr", "UK", "UK", "UK", "UK"),
                  Amount = c(70, 63, 48, 55, 35, 41, 39, 30, 2526, 2459, 2326, 2225, 8, 6,
                             7, 14, 23, 25, 28, 29)
)


ui <- fluidPage(
  setBackgroundColor(color = c("#66e0ff", "#00a3cc", "#003d4d")),
  titlePanel("Migration"),
  sidebarLayout(
    sidebarPanel(tags$style(".well {background-color:#e6f9ff;}"),
                 sliderInput(inputId = "range",
                             label = "Chose the year range:",
                             min = 2002, max = 2020, value = c(2002,2020)),
                 selectInput(inputId = "dis",
                             label = "Chose the district",
                             choices = unique(Eu1$District)),
                 selectInput(inputId = "con",
                             label = "Chose the place of birth",
                             choices = unique(Eu1$Country))
                 #checkboxGroupInput(inputId = "con",
                  #                  label = "Chose the place of birth",
                   #                 choices = unique(Eu1$Country),
                    #                selected = unique(Eu1$Country)[1])

    ),#sidebar panel
    mainPanel(plotOutput("graph1")) # closing main panel
  )#sidelayout panel
)#fluid page

server <- function(input, output){

  df_dat <- reactive({

    # make sure inputs are not NULL
    req(input$con, input$dis, input$range)

    # filter data according to inputs made by the user
    df_dat <- filter(Eu1, between(Year, input$range[1], input$range[2]), Districts == input$dis, Country %in% input$con)

    return(df_dat)
  })

  # Ensures that our filter works properly
  observe(print(str(df_dat())))

  # create a graph
  output$graph1 <- renderPlot({

    # use to debug:
    # browser()

    # make sure filtered data is not NULL
    req(df_dat())

    # plot filtered data
    ggplot(df_dat(), aes(x = Year, y = Amount)) +
      geom_line(aes(colour = Country)) +
      geom_point()
  })

}

shinyApp(ui = ui, server = server)
Problem in output:
Solution
You can use updateSelectInput to update it. Try this
server <- function(input, output, session){

  df_dat <- reactive({

    # make sure inputs are not NULL
    req(input$con, input$dis, input$range)

    # filter data according to inputs made by the user
    df_dat <- filter(Eu1, between(Year, input$range[1], input$range[2]), Districts == input$dis, Country %in% input$con)

    return(df_dat)
  })

  observeEvent(input$dis,{
    Eu <- filter(Eu1, between(Year, input$range[1], input$range[2]), Districts == input$dis)
    updateSelectInput(session,"con", choices=unique(Eu$Country))
  })

  # Ensures that our filter works properly
  observe(print(str(df_dat())))

  # create a graph
  output$graph1 <- renderPlot({

    # use to debug:
    # browser()

    # make sure filtered data is not NULL
    req(df_dat())

    # plot filtered data
    ggplot(df_dat(), aes(x = Year, y = Amount)) +
      geom_line(aes(colour = Country)) +
      geom_point()
  })

}
- How to group a flextable, a ggplot, a text and an image together into a grid object, then add it to a powerpoint slide
- Getting flextable to knit to PDF
- How to change the font of the first word in the footer of a flextable?
- Set a new header to the table dynamically from the labels of banner
- Create new column using group_by and adding number to value
- Aggregating Dataset to "ignore" categorical variable
- gt table tab spanner too long for table when knitting to pdf
- How to rename the target of a mutate statement
- making plotly subplots using crosstalk SharedData object
- Nested tabs in Quarto document
- Scrollbar Appears on kableExtra Tables with Download Button in Quarto — How to Remove?
- How to extract Std.Dev from VarCorr glmmTMB
- ggplot2 line chart gives "geom_path: Each group consist of only one observation. Do you need to adjust the group aesthetic?"
- How to properly combine two ggplots and properly align axis and strips/titles?
- Does the `by` argument in `avg_comparisons` compute the strata specific marginal effect?
- Add percentage labels to a bar chart
- How to remove excessive whitespace between columns in flextable?
- Cannot print crosstab with RMarkdown for a pdf document
- Seasonal Adjustment fails in newer versions or R
- dplyr if_any and numeric filtering?
- rcompanion::cldList() I am trying to re order CldList output to match figures order, and start with the group that my figure starts with
- How to hide/show a shinyWidgets dropdown with shinyjs?
- Create a dataframe column containing a list of number whose length is determined by another column
- How to avoid overlapping of legend types in ggplot2
- R lordif Rmarkdown
- r dplyr::left_join using datetime columns does not join properly
- Shiny checkboxGroup change size of box
- Aggregate dataframe in R to get mean of groups based on "detect flag"
- How do I add alternating white and grey shading to a plot with categorical variables on the y-axis?
- Why is the flextable caption different from the data.frame caption in officedown::rdocx_document outputs?
