Detect filled in black rectangles on patterned background with Python OpenCV
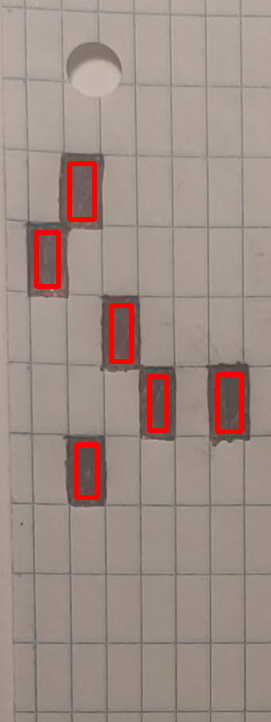
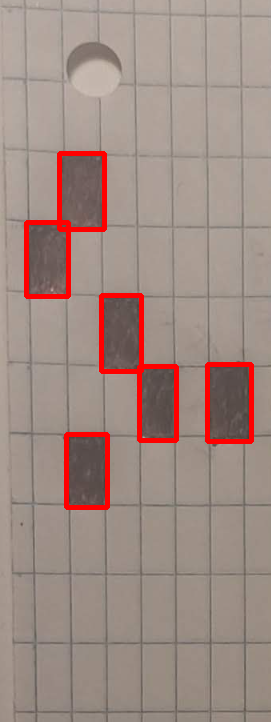
I'm trying to detect the location of these filled-in black rectangles using OpenCV.
I have tried to find the contours of these, but I think the background lines are also detected as objects. Also the rectangles aren't fully seperated (sometimes they touch a corner), and then they are detected as one, but I want the location of each of them seperately.
Here are the results I got, from the following code.
import numpy as np
import cv2

image = cv2.imread("page.jpg")

result = image.copy()
gray = cv2.cvtColor(image,cv2.COLOR_BGR2GRAY)

thresh = cv2.adaptiveThreshold(gray,255,cv2.ADAPTIVE_THRESH_GAUSSIAN_C, cv2.THRESH_BINARY_INV,51,9)

cnts = cv2.findContours(thresh, cv2.RETR_EXTERNAL, cv2.CHAIN_APPROX_SIMPLE)
cnts = cnts[0] if len(cnts) == 2 else cnts[1]
for c in cnts:
    cv2.drawContours(thresh, [c], -1, (255,255,255), -1)

kernel = cv2.getStructuringElement(cv2.MORPH_RECT, (3,3))
opening = cv2.morphologyEx(thresh, cv2.MORPH_OPEN, kernel, iterations=4)

cnts = cv2.findContours(opening, cv2.RETR_EXTERNAL, cv2.CHAIN_APPROX_SIMPLE)
cnts = cnts[0] if len(cnts) == 2 else cnts[1]
for c in cnts:
    x,y,w,h = cv2.boundingRect(c)
    cv2.rectangle(image, (x, y), (x + w, y + h), (36,255,12), 3)

cv2.imshow('thresh', thresh)
cv2.imshow('opening', opening)
cv2.imshow('image', image)
cv2.waitKey()
As you can see, in the Opening image, the white rectangles are joined with the black ones, but I want them seperately. Then in the Result, it just detects a contour around the entire page.
As I said in the comments, no need for adaptive thresholding. Simple problems are best solved with simple solutions. A simple threshold would suffice in your case, but I guess you did not want to do that because of the lines? Is there any reason why you went with adaptive thresholding?
Here's my appraoch:
- Read image
- Define threshold
- Generate an erosion rectangle with a width which you will need later
- Erode the binary mask
- Get contours
- For every contour, correct the properties of the rectangle, to account for the erosion step (more on this in the next two pictures)
- Print out, draw, save, go crazy...
Step number 6 is important, here's why: the erosion takes a chunk of your area, width and height. This can be clearly seen in the already accepted answer.
Before the correction, the rectangles will look like this:
Notice what I mentioned earlier, bad dimensions. By taking into account what has been eroded, we can closely estimate the actual rectangle:
I hope this helps you further, here's the code as a dump:
import cv2
%matplotlib qt
import matplotlib.pyplot as plt
import numpy as np
im = cv2.imread("stack.png") # read as BGR
imGray = cv2.imread("stack.png", cv2.IMREAD_GRAYSCALE) # read as gray
kernelSize = 20 # define the size of the erosion rectangle
smallRectangle = np.ones((kernelSize, kernelSize), dtype=np.uint8) # define the small erosion rectangle
mask = (imGray<130).astype("uint8") # get the mask based on a threshold, I think OTSU might work here as well
eroded = cv2.erode(mask, smallRectangle) # erode the image
contours, _ = cv2.findContours(eroded, cv2.RETR_CCOMP, cv2.CHAIN_APPROX_NONE) # find contours
for i, cnt in enumerate(contours): # for every cnt in cnts
    # parse the rectangle parameters
    x,y,w,h = cv2.boundingRect(cnt)
    # correct the identified boxes to account for erosion
    x -= kernelSize//2
    y -= kernelSize//2
    w += kernelSize
    h += kernelSize
    box = (x,y,w,h) # assemble box back
    # draw rectangle
    im = cv2.rectangle(im, box, (0,0,255), 3)
    # print out results
    print(f"Rectangle {i}:\n center at ({x+w//2}, {y+h//2})\n width {w} px\n height {h} px")
Results of the printing:
Rectangle 0:
 center at (87, 471)
 width 42 px
 height 74 px
Rectangle 1:
 center at (158, 403)
 width 38 px
 height 75 px
Rectangle 2:
 center at (229, 403)
 width 45 px
 height 78 px
Rectangle 3:
 center at (121, 333)
 width 41 px
 height 77 px
Rectangle 4:
 center at (47, 259)
 width 43 px
 height 75 px
Rectangle 5:
 center at (82, 191)
 width 46 px
 height 77 px
- PEP 668 Error (Externally managed environment) within Conda
- Sort within groups on entire table
- Error message "error: command 'gcc' failed with exit status 1" while installing eventlet
- Why would I want to install a package while ignoring dependencies?
- FastAPI authentication injection
- Python: Get size of string in bytes
- Beautiful Soup returns a none when I go to any other pages other than 1 in a website
- Is "*_" an acceptable way to ignore arguments in Python?
- When I tried easy_install greenlet, I got "error: Setup script exited with error: command 'gcc' failed with exit status 1"
- Parameter substitution for a SQLite "IN" clause
- Logging operation results in pandas (equivalent of STATA/tidylog)
- option to "import package" in Pycharm no longer available
- python exception message capturing
- In python 3 logical operator giving me an opposite result
- Using pattern matching with a class that inherits from str in Python 3.10
- Jinja2: render template inside template
- Why does comparing strings using either '==' or 'is' sometimes produce a different result?
- How to scroll down google maps using selenium python
- seaborn heatmap cell style for nan-Values
- Are predictions on scikit-learn models thread-safe?
- AttributeError: 'WSGIRequest' object has no attribute 'get' while making a get request
- How to extract drawing from PDF file to SVG
- How do I install and run a python script?
- Export module components in Python
- Yahoo Finance V7 API now requiring cookies? (Python)
- How do I add custom field to Python log format string?
- How to read responses from request in Robot Selenium
- How to update a variable on live
- Why does NumPy assign different string dtypes when mixing types in np.array()?
- How to plot data with Axes3D in python?

