How to sample point using LatinHyper Cube sampling in a random volume
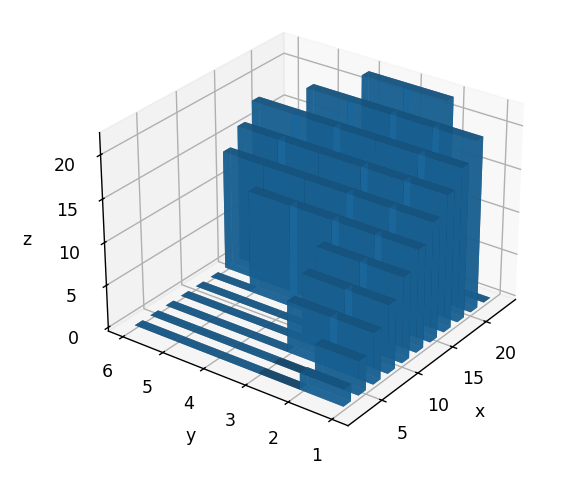
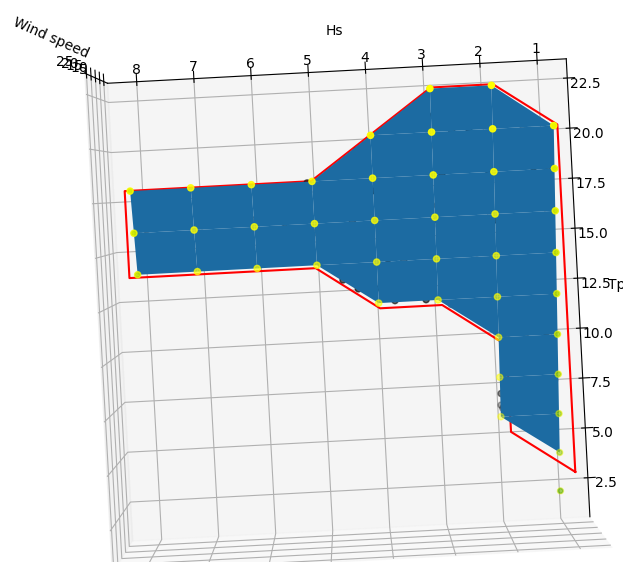
I have a a dataset composed of XYZ coordinates, which can be rendered in 3D bar chart as the picture below.
The main question I have is: how to generate X points (X being a user input) inside said volume ensuring the best representation possible ?
My first approach was to use the LatinHyper Cube sampling method, but as the name suggests it supposed a cubic design space. Here the volume could be any shape.
I then tried to applied the method described here: https://math.stackexchange.com/questions/2174751/generate-random-points-within-n-dimensional-ellipsoid I hoped the method could be tweaked to any shape rather the an ellipsoid. It is not the case (or at least, I failed to do so).
As a "bonus" question, I am not happy with the 3D histogram approach, I would rather have a "proper" volume. Using griddata implies a cubic base which is not the case here.
EDIT:
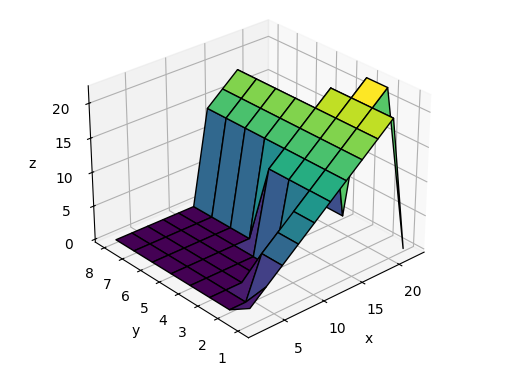
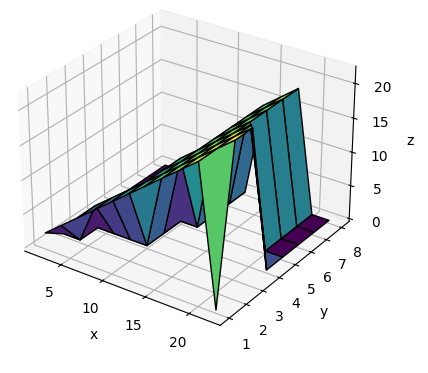
I managed to plot my data as a 3D surface, which is fine for my usage using the following:
data_2d = [
    [2, 4, 6, 8, 10, 12, 14, 16, 18, 20, 0],
    [0, 0, 6, 8, 10, 12, 14, 16, 18, 20, 22],
    [0, 0, 0, 0, 0, 12, 14, 16, 18, 20, 22],
    [0, 0, 0, 0, 0, 12, 14, 16, 18, 20, 0],
    [0, 0, 0, 0, 0, 0, 14, 16, 18, 0, 0],
    [0, 0, 0, 0, 0, 0, 14, 16, 18, 0, 0],
    [0, 0, 0, 0, 0, 0, 14, 16, 18, 0, 0],
    [0, 0, 0, 0, 0, 0, 14, 16, 18, 0, 0],
]
# data_2d: - rows are Hs from 1 to 8 (8 rows)
#          - columns are Tp from 2 to 22 (10 columns)
#          - content is the wind speed from 2 to 22

data_array = np.array(data_2d)
x_data, y_data = np.meshgrid(np.linspace(2, 22, 11), np.linspace(1, 8, 8))


ax = plt.axes(projection="3d")
ax.plot_surface(x_data, y_data, data_array, cmap="viridis", edgecolor="black")
ax.set_xlabel("x")
ax.set_ylabel("y")
ax.set_zlabel("z")
Actually, I split the issue in two steps:
- Generate LHS sampling in the XY plan bounded by a polygon
- For each sampled draw a random Z value bounded by an arbitrary minimum value and the calculated upper Z value.
Below is a MWE for whoever would be interested:
    from random import uniform
    import matplotlib.pyplot as plt
    import numpy as np
    import pandas as pd
    from scipy.interpolate import CloughTocher2DInterpolator as CT
    from scipy.stats import qmc
    from shapely.geometry import Point, Polygon

    data_2d = [
    [2, 4, 6, 8, 10, 12, 14, 16, 18, 20, np.nan],
    [np.nan, np.nan, 6, 8, 10, 12, 14, 16, 18, 20, 22],
    [np.nan, np.nan, np.nan, np.nan, np.nan, 12, 14, 16, 18, 20, 22],
    [np.nan, np.nan, np.nan, np.nan, np.nan, 12, 14, 16, 18, 20, np.nan],
    [np.nan, np.nan, np.nan, np.nan, np.nan, np.nan, 14, 16, 18, np.nan, np.nan],
    [np.nan, np.nan, np.nan, np.nan, np.nan, np.nan, 14, 16, 18, np.nan, np.nan],
    [np.nan, np.nan, np.nan, np.nan, np.nan, np.nan, 14, 16, 18, np.nan, np.nan],
    [np.nan, np.nan, np.nan, np.nan, np.nan, np.nan, 14, 16, 18, np.nan, np.nan],
]
# data_2d: - rows are Hs from 1 to 8 (8 rows)
#          - columns are Tp from 2 to 22 (10 columns)
#          - content is the wind speed from 2 to 22

tp_hs_ws = pd.DataFrame(data_2d)
tp_hs_ws.columns = [np.arange(2, 24, 2)]
tp_hs_ws.index = [np.arange(1, 9, 1)]
x_data, y_data = np.meshgrid(np.arange(2, 24, 2), np.arange(1, 9, 1))

non_nan_coord = [
    (2, 1),(20, 1),(22, 2),(22, 3),(22, 3),(20, 4),(18, 5),(18, 8),(14, 8),(14, 5),(12, 4),(12, 3),(10, 2),(6, 2),(2, 1)]

polygon = Polygon(non_nan_coord)
xp, yp = polygon.exterior.xy

points = LHS_Points_in_Polygon(polygon, nb_points)
xs = [point.x for point in points]
ys = [point.y for point in points]

# Keep only the unique LHS samples
xs = pd.Series(xs).unique()
ys = pd.Series(ys).unique()
xs_grid, ys_grid = np.meshgrid(xs, ys)

# Interpolate initial wind speed on the LHS Hs/Tp grid
zz = []
for z in (np.array(data_2d)).ravel():
    if str(z) == "nan":
        z = 0
    zz.append(z)

xy = np.c_[x_data.ravel(), y_data.ravel()]
CT_interpolant = CT(xy, zz)
Ws = CT_interpolant(xs_grid, ys_grid)

# Select the wind speed associated to the LHS Tp/Hs samples
ws = []
for idx_tp, _ in enumerate(xs_grid.ravel()):
    ws.append(Ws.ravel()[idx_tp])
# Make the LHS samples in square matrix form
ws_LHS = np.reshape(ws, (len(xs_grid), len(ys_grid)))
# The diagonal of wind speed LHS samples is corresponding to the XY coordinates sampled
ws_LHs_diag = ws_LHS.diagonal()

# Create random wind speed between 2m/s (arbitrary lower bound) and the LSH sampled wind speed value (upper bound)
# This ensure to produce a point XYZ always contained with the voume Tp/Hs/Wind speed
random_ws = [uniform(2, ws) for ws in ws_LHs_diag]
The function LHS_Points_in_Polygon is inspired by this solution.
def LHS_Points_in_Polygon(polygon, number):
    minx, miny, maxx, maxy = polygon.bounds
    sampler = qmc.LatinHypercube(d=2, scramble=False)
    sample = sampler.random(n=number)
    l_bounds = np.min((minx, miny))
    u_bounds = np.max((maxx, maxy))
    points = []
    while len(points) < number:
        for x, y in qmc.scale(sample, l_bounds, u_bounds):
            pnt = Point(x, y)
            if polygon.contains(pnt):
                points.append(pnt)
    return points
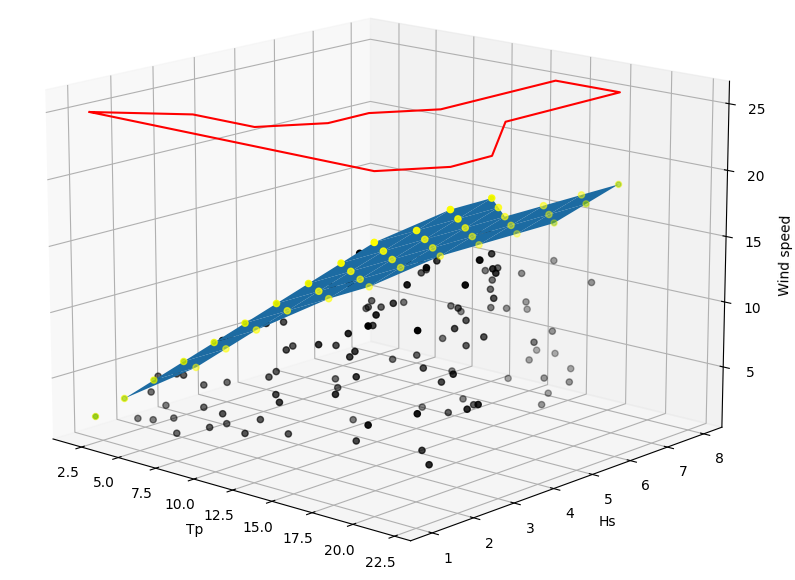
Below is the outcome:
- Python, Web Scraping
- Cannot scrape xpath using Selenium
- Scrapy script not scraping items
- why does the html all have same class and sub-class with different information
- Yfinace - Getting Too Many Requests. Rate limited. Try after a while
- Requests and BeautifulSoup to get video length from YouTube
- web scraping Proplem no such element
- Python/Selenium - Scraping Into Excel Sheet
- Scraping data using Network, Fetch, Response
- Python NLTK: Bigrams trigrams fourgrams
- Discovering Poetic Form with NLTK and CMU Dict
- Python Wand: MagickReadImage returns false, but did not raise ImageMagick exception
- Executing multi-line statements in the one-line command-line
- How to get the replit link for uptime robot?
- How to install TA-Lib On vscode/windows(64bit)
- Python injector doesn't work for NewType based on tuple[str, str]
- Python conditional list joins
- Why Can't VS Code Directly Run Python unittest .py's Or Discover In Testing Tab
- Limiting amount of objects user can add in another object
- I got warning as: "Name 'x' can be undefined" and "Global variable 'x' is undefined at the module level"
- How to split data into 3 sets (train, validation and test)?
- How can I set session details in conftest.py for yield along with fixture in pytest?
- Show DataFrame as table in iPython Notebook
- How to get all possible (2^N) combinations of a list’s elements, of any length
- Python Declare variables iteratively
- Quarto Unable to Render Python
- Filter pandas dataframe with specific column names in python
- Tkinter canvas image probably being garbage collected but creating a persistent reference does not solve the problem
- Why is Pipenv not picking up my Pyenv versions?
- Why do I get lots of terminal messages about files 'first seen with mtime' when starting django runserver?
