How to find out which graph is most similar to another graph?
I have this list of matrices in R:
 my_list =  structure(list(
        matrix(c(2,2,2,2,3, 1,2,2,2,3, 1,2,3,3,3, 1,2,1,3,3, 1,1,1,3,3), nrow=5, byrow=TRUE),
        matrix(c(1,1,1,2,2, 1,1,1,2,2, 1,1,1,3,3, 1,1,3,3,3, 1,1,3,3,3), nrow=5, byrow=TRUE),
        matrix(c(2,2,2,3,3, 2,2,2,3,3, 1,1,3,3,3, 1,1,3,3,3, 1,1,1,1,1), nrow=5, byrow=TRUE),
        matrix(c(3,3,3,3,3, 2,2,3,3,3, 2,2,2,3,3, 2,2,2,1,1, 1,1,1,1,1), nrow=5, byrow=TRUE),
        matrix(c(3,3,3,3,3, 1,1,1,2,2, 1,1,1,2,2, 1,1,1,2,2, 1,1,2,2,2), nrow=5, byrow=TRUE),
        matrix(c(1,1,1,3,3, 1,1,1,3,3, 1,1,1,2,2, 1,1,2,2,2, 1,1,2,2,2), nrow=5, byrow=TRUE),
        matrix(c(1,3,3,2,2, 1,3,3,2,2, 1,1,3,3,2, 1,1,1,3,2, 1,1,1,1,2), nrow=5, byrow=TRUE),
        matrix(c(1,1,1,2,2, 1,1,1,2,2, 1,1,1,2,3, 1,1,1,2,3, 1,1,2,2,2), nrow=5, byrow=TRUE),
        matrix(c(2,2,2,2,2, 3,3,3,3,3, 3,3,3,3,3, 1,1,3,3,3, 1,1,3,3,3), nrow=5, byrow=TRUE),
        matrix(c(1,1,1,1,1, 1,1,1,1,2, 3,1,1,1,2, 3,3,2,2,2, 3,3,2,2,2), nrow=5, byrow=TRUE),
        matrix(c(3,1,1,1,1, 3,3,1,1,1, 3,3,2,2,1, 2,2,2,1,1, 2,2,2,1,1), nrow=5, byrow=TRUE),
        matrix(c(3,3,3,3,3, 3,3,1,3,1, 2,2,1,1,1, 2,2,1,1,1, 2,2,1,1,1), nrow=5, byrow=TRUE),
        matrix(c(3,3,1,1,1, 3,1,1,1,1, 3,2,2,1,1, 3,2,2,2,2, 3,3,2,2,2), nrow=5, byrow=TRUE),
        matrix(c(1,1,1,1,1, 1,1,1,1,2, 1,1,1,1,2, 3,3,3,2,2, 3,3,2,2,2), nrow=5, byrow=TRUE),
        matrix(c(1,1,1,1,2, 1,1,1,3,2, 1,3,1,3,2, 1,3,3,3,2, 1,1,3,2,2), nrow=5, byrow=TRUE),
        matrix(c(3,3,3,3,3, 3,3,2,2,2, 3,3,2,2,2, 1,1,2,2,2, 1,1,2,2,2), nrow=5, byrow=TRUE),
        matrix(c(1,1,1,3,3, 1,1,1,3,3, 1,1,2,2,3, 1,1,1,2,3, 1,1,2,2,2), nrow=5, byrow=TRUE),
        matrix(c(1,1,1,1,3, 1,1,2,3,3, 1,1,2,3,3, 1,1,2,2,2, 1,2,2,2,2), nrow=5, byrow=TRUE),
        matrix(c(1,1,1,1,1, 1,2,2,1,1, 1,1,2,2,1, 3,3,2,2,2, 2,2,2,2,2), nrow=5, byrow=TRUE),
        matrix(c(3,3,3,1,1, 1,1,1,1,2, 1,1,1,1,2, 1,2,1,2,2, 1,2,2,2,2), nrow=5, byrow=TRUE),
        matrix(c(2,3,3,3,3, 2,3,3,3,3, 2,3,3,3,3, 2,2,2,1,1, 1,1,1,1,1), nrow=5, byrow=TRUE),
        matrix(c(2,2,2,2,2, 2,2,2,2,2, 2,2,2,2,2, 2,3,1,1,2, 3,3,1,1,1), nrow=5, byrow=TRUE),
        matrix(c(1,1,1,1,1, 1,1,1,1,1, 3,1,1,1,1, 2,2,1,1,1, 2,2,1,1,1), nrow=5, byrow=TRUE),
        matrix(c(1,1,1,3,3, 2,1,1,3,3, 2,2,1,1,3, 2,2,2,1,1, 2,2,2,2,2), nrow=5, byrow=TRUE),
        matrix(c(1,1,1,1,1, 1,1,1,1,1, 3,3,3,3,1, 2,2,2,2,1, 2,2,2,2,1), nrow=5, byrow=TRUE),
        matrix(c(3,3,3,3,1, 3,3,2,1,1, 3,3,2,1,1, 3,3,2,2,2, 3,3,2,2,2), nrow=5, byrow=TRUE),
        matrix(c(3,3,3,1,1, 3,3,3,1,1, 3,2,2,1,1, 2,2,2,1,1, 2,2,2,1,1), nrow=5, byrow=TRUE),
        matrix(c(2,2,2,1,1, 2,2,2,1,1, 2,2,1,1,1, 3,2,2,1,1, 3,3,1,1,1), nrow=5, byrow=TRUE),
        matrix(c(1,1,1,1,1, 1,2,1,1,1, 1,2,2,1,1, 1,1,2,3,3, 1,1,2,3,3), nrow=5, byrow=TRUE),
        matrix(c(1,1,3,3,3, 1,2,2,2,3, 1,2,2,3,3, 1,2,2,3,3, 1,1,1,3,3), nrow=5, byrow=TRUE),
        matrix(c(3,1,1,1,1, 3,1,1,1,1, 3,3,1,1,2, 3,1,1,2,2, 3,2,2,2,2), nrow=5, byrow=TRUE),
        matrix(c(1,1,1,3,3, 1,1,1,3,3, 2,3,3,3,3, 2,3,3,2,2, 2,2,2,2,2), nrow=5, byrow=TRUE),
        matrix(c(3,2,2,2,2, 3,2,2,2,2, 3,1,2,1,1, 3,1,1,1,1, 3,3,3,3,1), nrow=5, byrow=TRUE),
        matrix(c(3,3,3,3,3, 3,3,3,1,1, 2,1,1,1,1, 2,2,2,2,2, 2,2,2,2,2), nrow=5, byrow=TRUE),
        matrix(c(3,3,3,3,2, 3,3,3,3,2, 3,1,1,1,2, 3,1,1,1,1, 3,1,1,1,1), nrow=5, byrow=TRUE),
        matrix(c(3,3,2,2,2, 3,1,1,2,2, 3,1,1,2,2, 1,1,1,2,2, 1,1,1,2,2), nrow=5, byrow=TRUE)
    ), class = "list")
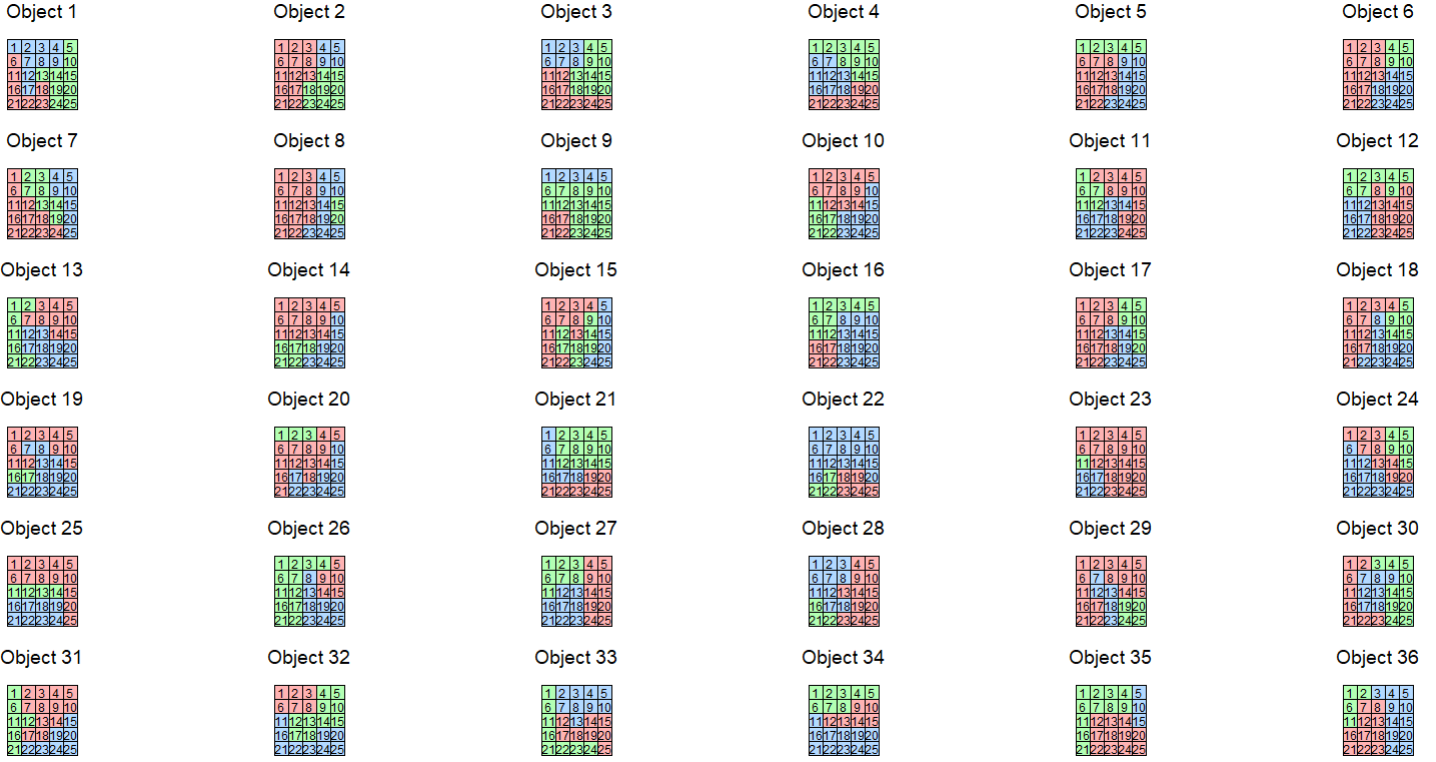
I then plotted all of them using the following code:
library(ggplot2)
library(gridExtra)
library(reshape2)
library(dplyr)

plot_matrix <- function(mat, plot_number) {
    df <- melt(mat)
    names(df) <- c("row", "col", "value")

    df$index <- (df$row - 1) * 5 + df$col

    colors <- c(
        "1" = "#FFB3B3",
        "2" = "#B3D9FF",
        "3" = "#B3FFB3"
    )

    p <- ggplot(df, aes(x = col, y = -row, fill = factor(value))) +
        geom_tile(color = "black", linewidth = 0.5) +
        geom_text(aes(label = index), size = 3) +
        scale_fill_manual(values = colors) +
        labs(title = paste("Object", plot_number)) +
        coord_equal() +
        theme_minimal() +
        theme(
            legend.position = "none",
            plot.title = element_text(hjust = 0.5, margin = margin(b = 10)),
            axis.text = element_blank(),
            axis.title = element_blank(),
            panel.grid = element_blank(),
            plot.margin = margin(5, 5, 5, 5)
        )

    return(p)
}

plot_list <- lapply(seq_along(my_list), function(i) {
    plot_matrix(my_list[[i]], i)
})

n_plots <- length(plot_list)
n_cols <- 6
n_rows <- ceiling(n_plots / n_cols)

grid.arrange(
    grobs = plot_list,
    ncol = n_cols,
    nrow = n_rows,
    padding = unit(2, "mm")
)
I have the following question: If we take object 1 - is there something we can do to find out which of the remaining objects is "most similar" to object 1 based on : A) distribution of colors AND B) shape of color boundaries AND C) placement of color boundaries?
My current approach is to answer each one of these questions separately and average them. For example:
A) Find out the color distribution of each object as a vector and take the euclidean distance between object 1 and all other objects.
B) and C) Use something like Jaccard Distance or Hausdorf Distance between object 1 and all other objects
take the average of all differences to get an idea of general similarity. The pair (object1, object_i) with the lowest average is most similar
I am not sure how correct this approach is and I was wondering if there is something easier.
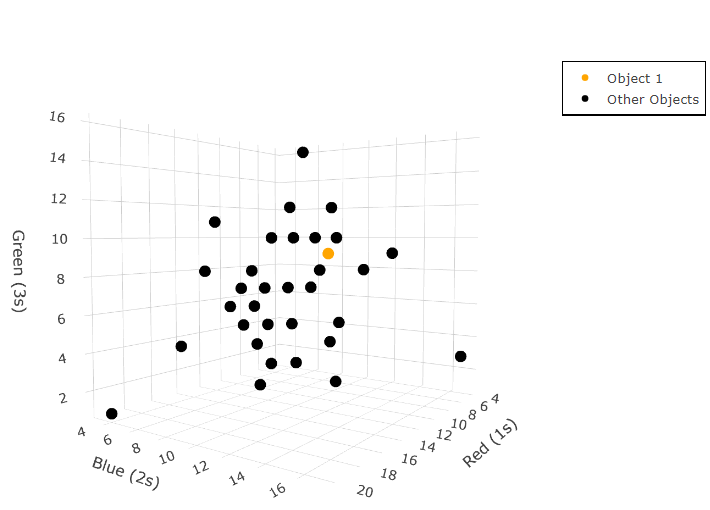
An idea for A)
library(plotly)

color_counts <- data.frame(
    object = 1:length(my_list),
    red = sapply(my_list, function(mat) sum(mat == 1)),
    blue = sapply(my_list, function(mat) sum(mat == 2)),
    green = sapply(my_list, function(mat) sum(mat == 3))
)

point_colors <- ifelse(color_counts$object == 1, "orange", "black")

plot_ly(color_counts,
        x = ~red,
        y = ~blue,
        z = ~green,
        text = ~paste("Object", object),
        type = "scatter3d",
        mode = "markers",
        marker = list(
            color = point_colors,
            size = 6  # Making points slightly larger for better visibility
        )) %>%
    layout(scene = list(
        xaxis = list(title = "Red (1s)"),
        yaxis = list(title = "Blue (2s)"),
        zaxis = list(title = "Green (3s)")
    ))
This question is hard to answer, but Part A and Part B should be relatively straightforward, hclust() and a some sort of jaccard distance can be calculated (although not the traditional jaccard 'how many things in common', as all Objects have the same values (1, 2, and 3) but in they're in different positions).
The part that I'm struggling with is:
B) shape of color boundaries AND C) placement of color boundaries?
This is way outside my area of expertise, but perhaps the clustering-type approaches might help you get started.
E.g.
library(tidyverse)
my_list =  structure(list(
  matrix(c(2,2,2,2,3, 1,2,2,2,3, 1,2,3,3,3, 1,2,1,3,3, 1,1,1,3,3), nrow=5, byrow=TRUE),
  matrix(c(1,1,1,2,2, 1,1,1,2,2, 1,1,1,3,3, 1,1,3,3,3, 1,1,3,3,3), nrow=5, byrow=TRUE),
  matrix(c(2,2,2,3,3, 2,2,2,3,3, 1,1,3,3,3, 1,1,3,3,3, 1,1,1,1,1), nrow=5, byrow=TRUE),
  matrix(c(3,3,3,3,3, 2,2,3,3,3, 2,2,2,3,3, 2,2,2,1,1, 1,1,1,1,1), nrow=5, byrow=TRUE),
  matrix(c(3,3,3,3,3, 1,1,1,2,2, 1,1,1,2,2, 1,1,1,2,2, 1,1,2,2,2), nrow=5, byrow=TRUE),
  matrix(c(1,1,1,3,3, 1,1,1,3,3, 1,1,1,2,2, 1,1,2,2,2, 1,1,2,2,2), nrow=5, byrow=TRUE),
  matrix(c(1,3,3,2,2, 1,3,3,2,2, 1,1,3,3,2, 1,1,1,3,2, 1,1,1,1,2), nrow=5, byrow=TRUE),
  matrix(c(1,1,1,2,2, 1,1,1,2,2, 1,1,1,2,3, 1,1,1,2,3, 1,1,2,2,2), nrow=5, byrow=TRUE),
  matrix(c(2,2,2,2,2, 3,3,3,3,3, 3,3,3,3,3, 1,1,3,3,3, 1,1,3,3,3), nrow=5, byrow=TRUE),
  matrix(c(1,1,1,1,1, 1,1,1,1,2, 3,1,1,1,2, 3,3,2,2,2, 3,3,2,2,2), nrow=5, byrow=TRUE),
  matrix(c(3,1,1,1,1, 3,3,1,1,1, 3,3,2,2,1, 2,2,2,1,1, 2,2,2,1,1), nrow=5, byrow=TRUE),
  matrix(c(3,3,3,3,3, 3,3,1,3,1, 2,2,1,1,1, 2,2,1,1,1, 2,2,1,1,1), nrow=5, byrow=TRUE),
  matrix(c(3,3,1,1,1, 3,1,1,1,1, 3,2,2,1,1, 3,2,2,2,2, 3,3,2,2,2), nrow=5, byrow=TRUE),
  matrix(c(1,1,1,1,1, 1,1,1,1,2, 1,1,1,1,2, 3,3,3,2,2, 3,3,2,2,2), nrow=5, byrow=TRUE),
  matrix(c(1,1,1,1,2, 1,1,1,3,2, 1,3,1,3,2, 1,3,3,3,2, 1,1,3,2,2), nrow=5, byrow=TRUE),
  matrix(c(3,3,3,3,3, 3,3,2,2,2, 3,3,2,2,2, 1,1,2,2,2, 1,1,2,2,2), nrow=5, byrow=TRUE),
  matrix(c(1,1,1,3,3, 1,1,1,3,3, 1,1,2,2,3, 1,1,1,2,3, 1,1,2,2,2), nrow=5, byrow=TRUE),
  matrix(c(1,1,1,1,3, 1,1,2,3,3, 1,1,2,3,3, 1,1,2,2,2, 1,2,2,2,2), nrow=5, byrow=TRUE),
  matrix(c(1,1,1,1,1, 1,2,2,1,1, 1,1,2,2,1, 3,3,2,2,2, 2,2,2,2,2), nrow=5, byrow=TRUE),
  matrix(c(3,3,3,1,1, 1,1,1,1,2, 1,1,1,1,2, 1,2,1,2,2, 1,2,2,2,2), nrow=5, byrow=TRUE),
  matrix(c(2,3,3,3,3, 2,3,3,3,3, 2,3,3,3,3, 2,2,2,1,1, 1,1,1,1,1), nrow=5, byrow=TRUE),
  matrix(c(2,2,2,2,2, 2,2,2,2,2, 2,2,2,2,2, 2,3,1,1,2, 3,3,1,1,1), nrow=5, byrow=TRUE),
  matrix(c(1,1,1,1,1, 1,1,1,1,1, 3,1,1,1,1, 2,2,1,1,1, 2,2,1,1,1), nrow=5, byrow=TRUE),
  matrix(c(1,1,1,3,3, 2,1,1,3,3, 2,2,1,1,3, 2,2,2,1,1, 2,2,2,2,2), nrow=5, byrow=TRUE),
  matrix(c(1,1,1,1,1, 1,1,1,1,1, 3,3,3,3,1, 2,2,2,2,1, 2,2,2,2,1), nrow=5, byrow=TRUE),
  matrix(c(3,3,3,3,1, 3,3,2,1,1, 3,3,2,1,1, 3,3,2,2,2, 3,3,2,2,2), nrow=5, byrow=TRUE),
  matrix(c(3,3,3,1,1, 3,3,3,1,1, 3,2,2,1,1, 2,2,2,1,1, 2,2,2,1,1), nrow=5, byrow=TRUE),
  matrix(c(2,2,2,1,1, 2,2,2,1,1, 2,2,1,1,1, 3,2,2,1,1, 3,3,1,1,1), nrow=5, byrow=TRUE),
  matrix(c(1,1,1,1,1, 1,2,1,1,1, 1,2,2,1,1, 1,1,2,3,3, 1,1,2,3,3), nrow=5, byrow=TRUE),
  matrix(c(1,1,3,3,3, 1,2,2,2,3, 1,2,2,3,3, 1,2,2,3,3, 1,1,1,3,3), nrow=5, byrow=TRUE),
  matrix(c(3,1,1,1,1, 3,1,1,1,1, 3,3,1,1,2, 3,1,1,2,2, 3,2,2,2,2), nrow=5, byrow=TRUE),
  matrix(c(1,1,1,3,3, 1,1,1,3,3, 2,3,3,3,3, 2,3,3,2,2, 2,2,2,2,2), nrow=5, byrow=TRUE),
  matrix(c(3,2,2,2,2, 3,2,2,2,2, 3,1,2,1,1, 3,1,1,1,1, 3,3,3,3,1), nrow=5, byrow=TRUE),
  matrix(c(3,3,3,3,3, 3,3,3,1,1, 2,1,1,1,1, 2,2,2,2,2, 2,2,2,2,2), nrow=5, byrow=TRUE),
  matrix(c(3,3,3,3,2, 3,3,3,3,2, 3,1,1,1,2, 3,1,1,1,1, 3,1,1,1,1), nrow=5, byrow=TRUE),
  matrix(c(3,3,2,2,2, 3,1,1,2,2, 3,1,1,2,2, 1,1,1,2,2, 1,1,1,2,2), nrow=5, byrow=TRUE)
), class = "list")

library(ggplot2)
library(gridExtra)
#>
#> Attaching package: 'gridExtra'
#> The following object is masked from 'package:dplyr':
#>
#>     combine
library(reshape2)
#>
#> Attaching package: 'reshape2'
#> The following object is masked from 'package:tidyr':
#>
#>     smiths
library(dplyr)

plot_matrix <- function(mat, plot_number) {
  df <- melt(mat)
  names(df) <- c("row", "col", "value")

  df$index <- (df$row - 1) * 5 + df$col

  colors <- c(
    "1" = "#FFB3B3",
    "2" = "#B3D9FF",
    "3" = "#B3FFB3"
  )

  p <- ggplot(df, aes(x = col, y = -row, fill = factor(value))) +
    geom_tile(color = "black", linewidth = 0.5) +
    geom_text(aes(label = index), size = 3) +
    scale_fill_manual(values = colors) +
    labs(title = paste("Object", plot_number)) +
    coord_equal() +
    theme_minimal() +
    theme(
      legend.position = "none",
      plot.title = element_text(hjust = 0.5, margin = margin(b = 10)),
      axis.text = element_blank(),
      axis.title = element_blank(),
      panel.grid = element_blank(),
      plot.margin = margin(5, 5, 5, 5)
    )

  return(p)
}

plot_list <- lapply(seq_along(my_list), function(i) {
  plot_matrix(my_list[[i]], i)
})

n_plots <- length(plot_list)
n_cols <- 6
n_rows <- ceiling(n_plots / n_cols)

grid.arrange(
  grobs = plot_list,
  ncol = n_cols,
  nrow = n_rows,
  padding = unit(2, "mm")
)

my_list
#> [[1]]
#>      [,1] [,2] [,3] [,4] [,5]
#> [1,]    2    2    2    2    3
#> [2,]    1    2    2    2    3
#> [3,]    1    2    3    3    3
#> [4,]    1    2    1    3    3
#> [5,]    1    1    1    3    3
#>
#> [[2]]
#>      [,1] [,2] [,3] [,4] [,5]
#> [1,]    1    1    1    2    2
#> [2,]    1    1    1    2    2
#> [3,]    1    1    1    3    3
#> [4,]    1    1    3    3    3
#> [5,]    1    1    3    3    3
#>
#> ...
#>
#> [[36]]
#>      [,1] [,2] [,3] [,4] [,5]
#> [1,]    3    3    2    2    2
#> [2,]    3    1    1    2    2
#> [3,]    3    1    1    2    2
#> [4,]    1    1    1    2    2
#> [5,]    1    1    1    2    2
#>
#> attr(,"class")
#> [1] "list"

# combine all of the melted matrices into a single dataframe
list_of_dfs <- map(seq_along(my_list), ~melt(my_list[[.x]]) %>%
                     mutate(id = .x) %>%
                     pivot_wider(id_cols = id,
                                 names_from = c(Var1, Var2),
                                 values_from = value)) %>%
  bind_rows()

# get all of the combinations, e.g. Object 1 vs 1, 1 vs 2, etc
combinations <- expand.grid(1:nrow(list_of_dfs), 1:nrow(list_of_dfs)) %>%
  filter(Var1 != Var2)
output <- map2(combinations$Var2, combinations$Var1, ~sum(list_of_dfs[.x,] == list_of_dfs[.y,]))
combinations$total_matches <- unlist(output)

# check the top matches i.e. how many values are in the same place
head(combinations[order(combinations$total_matches, decreasing = TRUE),], 15)
#>     Var1 Var2 total_matches
#> 328   14   10            23
#> 465   10   14            23
#> 125   21    4            21
#> 191   17    6            21
#> 566    6   17            21
#> 704    4   21            21
#> 261   17    8            20
#> 376   27   11            20
#> 568    8   17            20
#> 921   11   27            20
#> 29    30    1            19
#> 42     8    2            19
#> 145    6    5            19
#> 159   20    5            19
#> 175   36    5            19
Looks like Object 30 is the closest match to Object 1 (i.e. it has 19 values in the same position in the matrices). Using hclust you get the same answer:
list_of_dfs <- map(seq_along(my_list), ~melt(my_list[[.x]]) %>%
                     mutate(id = .x) %>%
                     pivot_wider(id_cols = id,
                                 names_from = c(Var1, Var2),
                                 values_from = value)) %>%
  bind_rows() %>%
  dplyr::mutate(across(-id, ~scale(.x)))

hc <- hclust(dist(list_of_dfs[-1]), method = "complete")
plot(hc)

Created on 2024-12-16 with reprex v2.1.0
Hope this helps; good luck!
- How to find correct projection of the shapefile data for leaflet map in r?
- How to use regex in R to shorten strings by one space
- R CRAN Check fail when using parallel functions
- Replacing several rows of data in a column efficiently using condition in a pipeline
- Iterate over vectors from an imported dataframe row-wise
- Split the legend into three rows with headings for a nested facet_wrap
- Why replace works with a boolean mask?
- Not able properly rasterize polygon dataset using terra::rasterize()
- Less than symbol ("<") in cloze schoice in Canvas (html select dropdown) shows as &lt;
- R/exams docx output does not include images
- How to have primitive discard additional arguments
- Functions Causing Objects to Disappear
- How to repel texts equidistantly on a secondary y-axis of a facet_grid?
- How can I add some text to a ggplot2 graph in R outside the plot area?
- Extracting Exact p-values from the "did" Package Output in R
- How can I set column types of several columns in empty R data frame?
- Adjust vertical line based on maximum value in graph plotly
- Combining Two Dataframes Based on Multiple Conditions & Removing Rows that Don't Match
- independent sample t-test in R using test statistics (mean, std. dev, count)
- How do I load a package without installing it in R?
- survcheck: 'x' must be an array of at least two dimensions
- Insert variable names and their specific values between the last column of facets and the strips of a facet_grid in R
- Use a recorded plot for officer
- Errors when using RStudio's Git tools
- Orientation of an irregular window changes the distance r over which secondary summary statistics are estimated
- Elegant way to check for missing packages and install them?
- How to create tmap labels along lines with rotated crs?
- How to access the value of a reactive output inside the browser console with jQuery?
- Convert excel column names to numbers
- How to adjust a node width in a Sankey plot in R?

